Freezer Temperature Mapping Guide
When your pharmaceutical products, biological samples, or temperature-sensitive foods experience unexpected freezer temperature fluctuations, the consequences can be devastating. A single undetected warm excursion in a -20°C freezer can compromise vaccine efficacy, render clinical trial specimens unusable, or spoil expensive food inventory—costing organizations thousands in wasted products and potential regulatory penalties. Freezer temperature mapping isn’t just a compliance checkbox; it’s your first line of defense against costly failures in cold chain integrity. In this guide, you’ll discover the precise methodology for conducting scientifically valid temperature mapping studies that satisfy regulatory requirements while protecting your valuable inventory.
Understanding Temperature Variability Within Freezers
Why Uniform Temperature Distribution Is a Myth
Contrary to common assumptions, freezers don’t maintain perfectly uniform temperatures throughout their chambers. Critical temperature variations of 3-7°C can exist between different locations within the same unit, particularly near doors, vents, and corners. These microclimates create dangerous hot spots where products may unknowingly experience excursions outside required ranges. During defrost cycles—which many users don’t even realize are occurring—temperatures can temporarily spike 10-15°C above set points, potentially compromising sensitive materials stored on upper shelves near the evaporator coil.
Identifying Your Freezer’s Critical Zones
Every freezer has predictable problem areas that require special attention during mapping:
– Door perimeter zones where frequent access causes rapid temperature fluctuations
– Near evaporator coils where cold air originates but may not circulate effectively
– Bottom corners that often become warmer due to poor air circulation
– Directly behind stored products where airflow gets obstructed
– Near drainage points where moisture accumulation affects thermal stability
Pro Tip: Map your freezer both empty and fully loaded—temperature distribution changes dramatically based on inventory density. A unit that performs well when empty often develops significant hot spots when packed with product.
Regulatory Requirements Driving Temperature Mapping
FDA and EU Compliance Mandates
The FDA’s Current Good Manufacturing Practices (cGMP) and EU Good Distribution Practice guidelines explicitly require temperature mapping of all storage units for pharmaceutical products. These regulations mandate documented evidence that your freezer maintains required temperatures at all storage locations, not just where the built-in sensor sits. Regulatory inspectors routinely request your most recent mapping study during audits, and deficiencies can trigger Form 483 observations or even product seizure.
Validation Protocols Required by Industry Standards
Your temperature mapping study must follow scientifically sound protocols that address:
– Minimum 24-hour duration covering multiple defrost cycles
– Data logger placement at minimum 9 strategic points (more for larger units)
– Simultaneous monitoring of all locations
– Documentation of freezer loading configuration during testing
– Analysis of worst-case scenarios including door openings
Critical Mistake to Avoid: Using the freezer’s built-in display as your validation tool. These single-point sensors don’t reflect conditions throughout the chamber and don’t provide the audit trail required by regulators.
Step-by-Step Temperature Mapping Procedure
Pre-Mapping Preparation Essentials
Before deploying data loggers, stabilize your freezer for at least 48 hours with normal inventory loading. Verify your monitoring equipment has current calibration certificates traceable to NIST standards—uncalibrated devices invalidate your entire study. Plan your mapping during a period of typical usage patterns, not during unusually quiet or busy operational periods that wouldn’t reflect real-world conditions.
Strategic Data Logger Placement Protocol
Follow this precise placement methodology for pharmaceutical-grade validation:
1. Position one logger at each corner (top and bottom) – 8 total
2. Place one in the geometric center of the chamber
3. Add additional loggers near known problem areas (door seals, vents)
4. Position loggers at multiple heights, especially near top shelf where warm air rises
5. Ensure loggers don’t touch product or walls (use stands to simulate product air gaps)
Time Estimate: Proper placement takes 15-20 minutes but determines the entire study’s validity.
Running and Analyzing Your Mapping Study
Execute your study over a minimum 24-hour period that captures:
– At least two complete defrost cycles
– Normal door opening frequency (document each opening)
– Power interruption scenarios (if testing recovery capability)
– Seasonal temperature extremes (repeat mapping quarterly)
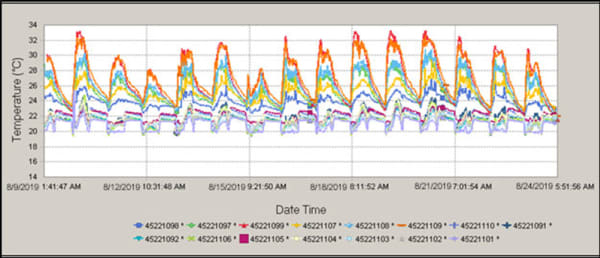
When analyzing data, focus on identifying:
– Maximum temperature differentials between locations
– Duration of excursions during door openings
– Recovery time to set point after disturbances
– Consistency of performance across multiple cycles
Pro Tip: Create thermal profile maps showing color-coded temperature zones—these visualizations make problem areas immediately obvious to staff and auditors.
Interpreting Results and Implementing Corrective Actions
Determining Acceptable Temperature Variation
For most pharmaceutical applications, temperature variation should not exceed ±3°C throughout the chamber during stable operation. During door openings, brief excursions may occur but should recover to within range within 5 minutes. If your mapping shows variations exceeding these thresholds, you must either reconfigure storage practices or address equipment deficiencies before storing critical products.
Critical Storage Configuration Adjustments
Based on your mapping results, implement these proven solutions:
– Restrict high-risk zones: Designate certain shelves or areas as unsuitable for the most temperature-sensitive products
– Optimize airflow: Install perforated shelves and maintain minimum 2-inch clearance around all products
– Standardize door procedures: Implement strict 30-second maximum door open time protocols
– Strategic product placement: Store critical items away from door seals and near the chamber’s thermal center
– Add supplemental monitoring: Place continuous monitors in identified hot spots
Warning: Never place products directly against freezer walls—the temperature at the wall surface can differ significantly from the air temperature.
Maintaining Ongoing Temperature Assurance
Creating an Effective Re-Mapping Schedule
Temperature mapping isn’t a one-time requirement. Establish a re-mapping schedule based on:
– Criticality of stored products: High-risk items require quarterly mapping
– Equipment age: Older freezers need more frequent validation (every 3-6 months)
– Operational changes: Remap after any modification to storage configuration or usage patterns
– Seasonal variations: Conduct summer and winter mappings to capture ambient temperature impacts
Documentation Requirements for Auditors
Your complete temperature mapping dossier must include:
– Signed protocol approved before study execution
– Calibration certificates for all monitoring equipment
– Raw data files with timestamps
– Thermal profile maps showing temperature distribution
– Deviation reports for any excursions during the study
– Corrective action documentation for identified issues
– Final validation report with approval signatures
Expert Note: Digital data loggers with encrypted audit trails are increasingly required by regulators—paper charts no longer satisfy documentation requirements for critical applications.
Cost-Benefit Analysis of Proper Temperature Mapping
While a comprehensive mapping study requires investment in qualified monitoring equipment and staff time, it delivers substantial ROI through:
– Prevention of single inventory loss events that can exceed $50,000
– Avoidance of regulatory fines and remediation costs
– Elimination of unnecessary product retesting after suspected excursions
– Extended equipment life through early problem detection
– Reduced energy consumption from optimized freezer operation
Organizations that skip proper temperature mapping often discover—too late—that their “validated” storage was actually compromising product quality for months or years. The modest investment in scientific mapping pays for itself many times over in avoided losses and regulatory compliance.
Final Note: Temperature mapping transforms freezer management from guesswork to science. By understanding your equipment’s actual performance characteristics, you gain the confidence that your valuable products remain protected at all times. Implement these protocols consistently, document thoroughly, and review results regularly to maintain the highest standards of product safety and regulatory compliance. For critical applications, consider partnering with a qualified validation specialist for your initial mapping study to ensure regulatory acceptance.